Telemetry
Intel® AI for Enterprise RAG services emit metrics, logs, and traces to the platform observability stack (Prometheus + Grafana + Loki + Tempo). This doc covers accessing Grafana and the RAG-specific dashboards.
Login
Visit https://grafana.<base_domain_name> (default: https://grafana.solutions.ai).
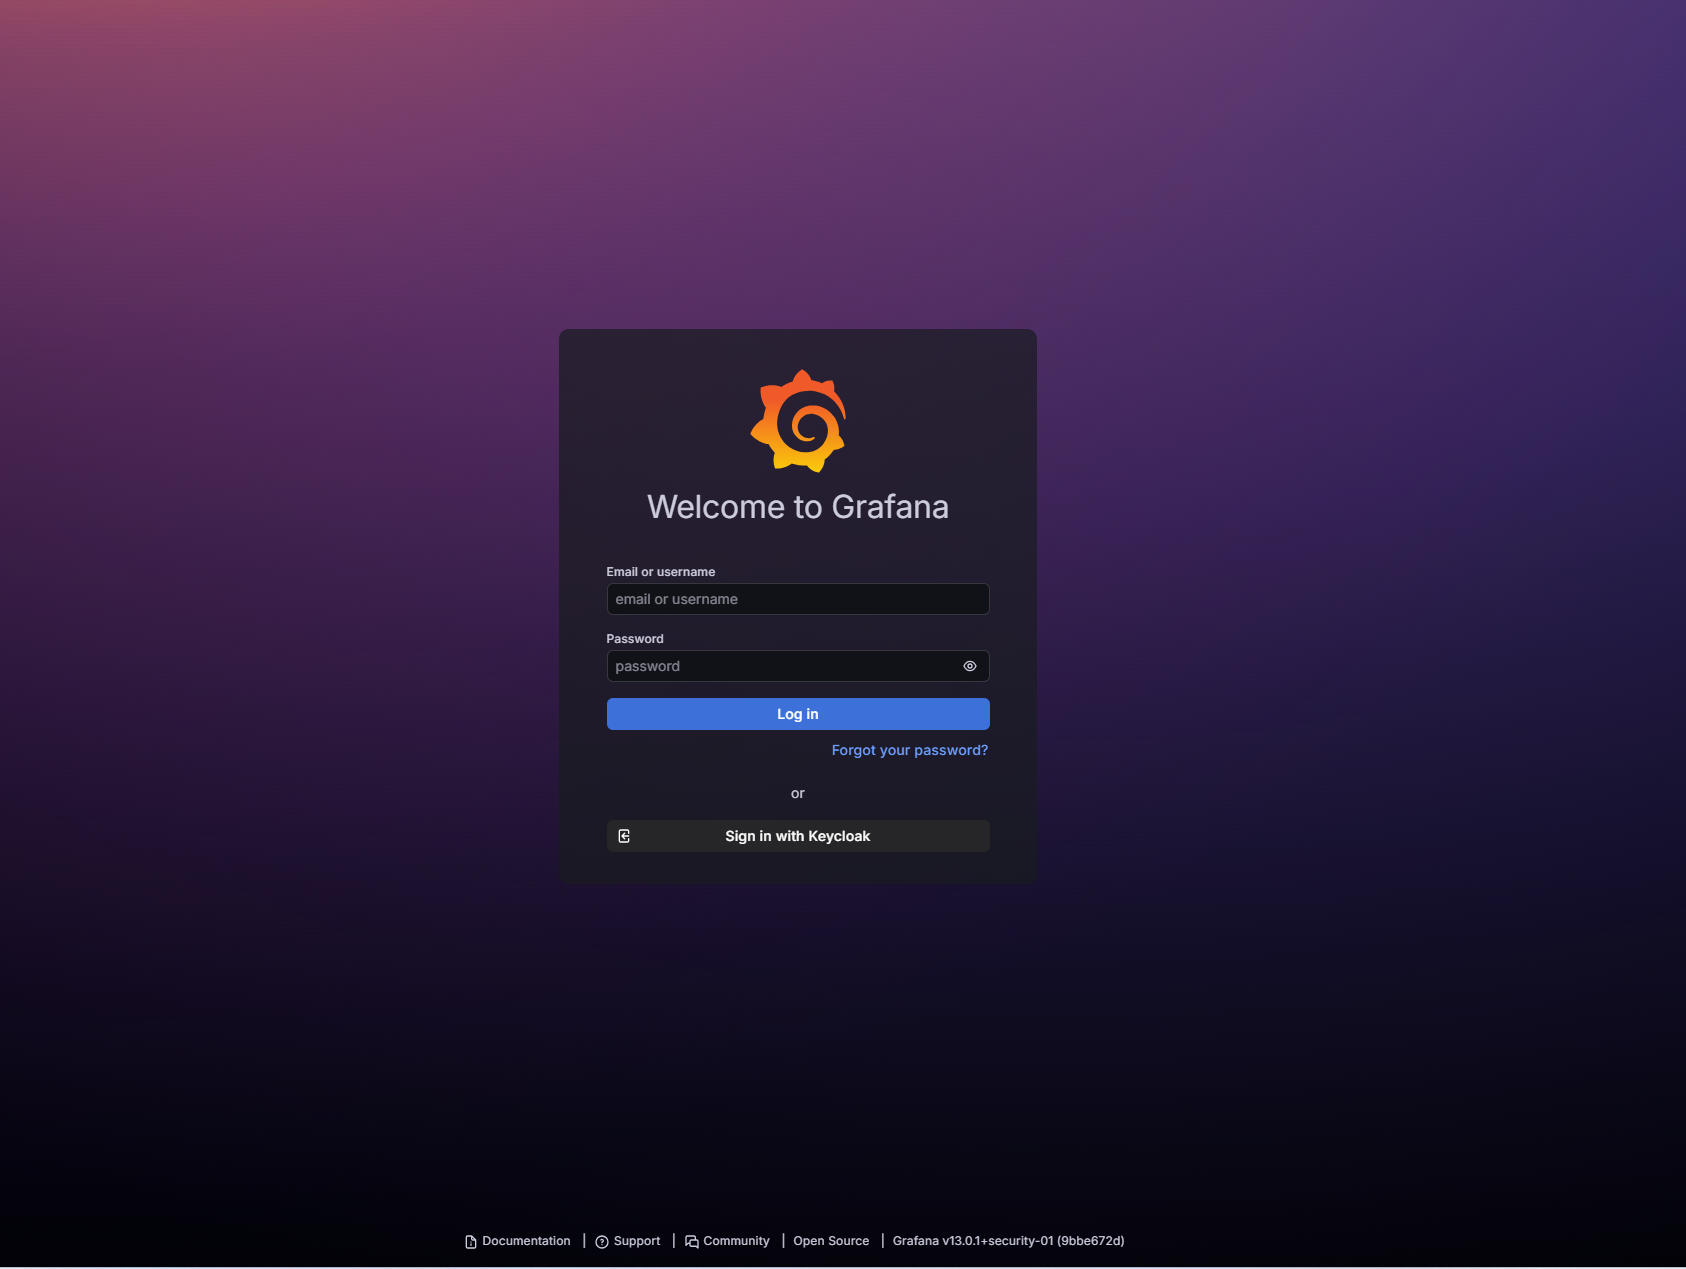
Two sign-in methods:
Grafana admin credentials
Retrieve the admin password from the grafana-admin-credentials secret in the monitoring namespace:
kubectl get secret -n monitoring grafana-admin-credentials \
  -o jsonpath='{.data.password}' | base64 -d; echo
# Username: admin
Keycloak SSO
On the Grafana login page, select Sign in with Keycloak and enter your username and password. Only users in the erag-admins or erag-maintainers Keycloak group can access Grafana.
Dashboards
Click Dashboards in the left pane. Dashboards prefixed with EnterpriseRAG are tailored to Intel AI for Enterprise RAG services. The Grafana instance also provides standard Kubernetes, Node Exporter, and Prometheus Overview dashboards for cluster-level monitoring.
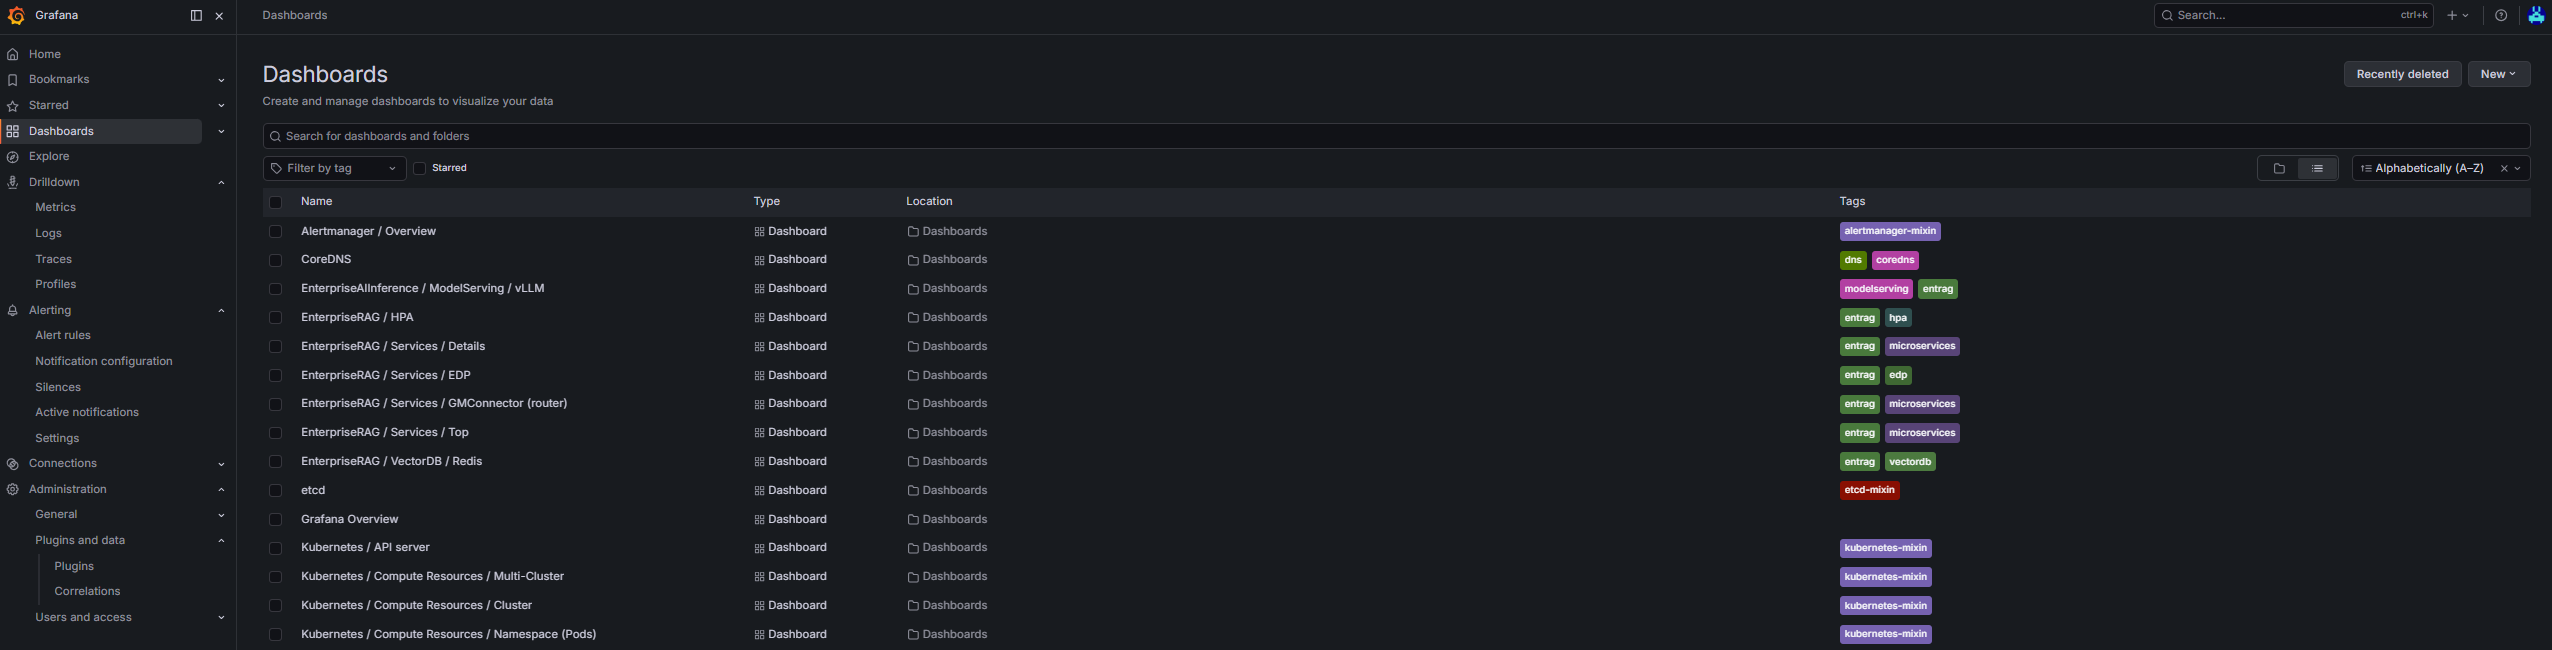
Eight dashboards ship with this layer, each provisioned by the component that owns it:
| Dashboard | Shipped by | Covers |
|---|---|---|
EnterpriseRAG / Services / Details | app_pipeline (gmc chart) | Per-service resource use, API traffic, and logs |
EnterpriseRAG / Services / Top | app_pipeline (gmc chart) | Cross-service summary of the busiest microservices |
EnterpriseRAG / Services / GMConnector (router) | app_pipeline (gmc chart) | Pipeline router throughput and per-step timing |
EnterpriseRAG / Services / EDP | app_edp | Ingestion counts, chunks, stages, and errors |
EnterpriseRAG / Services / Audio | app_audio | ASR and TTS activity (AudioQnA flavour only) |
EnterpriseRAG / HPA | app_hpa | Replica counts and scaling decisions |
EnterpriseRAG / VectorDB / Redis | app_vector_databases | Redis vector store health and query load |
EnterpriseRAG / VectorDB / Microsoft SQL Server | app_vector_databases | MSSQL vector store health and query load |
A dashboard only appears if its component is enabled, so the Audio and VectorDB dashboards depend on the flavour and the vector_databases_vector_store you chose.
The three most-used ones are described below.
EnterpriseRAG / Services / Details
Overview of resource usage and service activity for selected namespace and services.
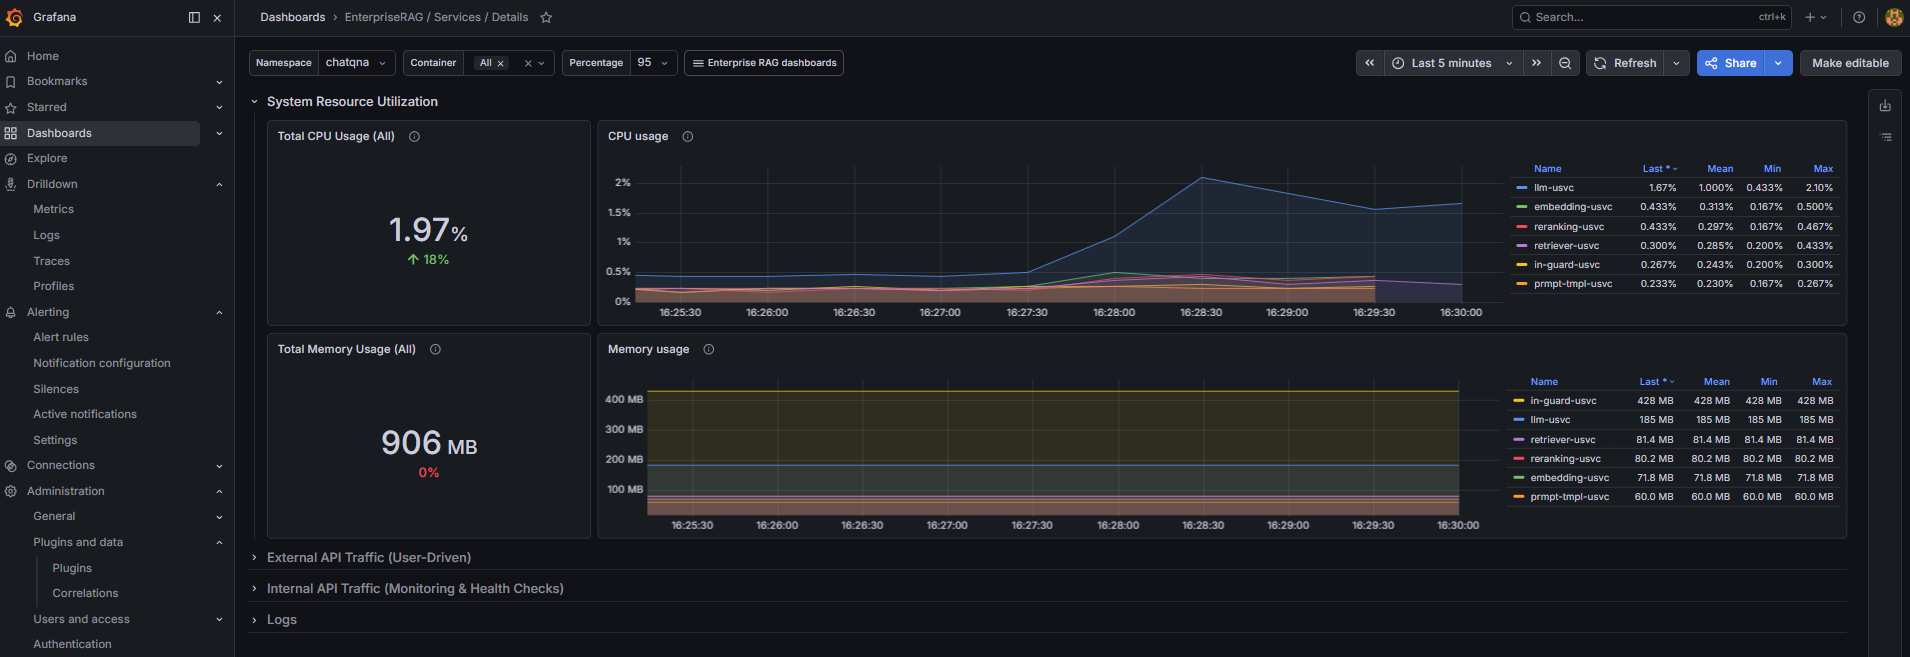
Key panels:
- System Resource Utilization: CPU and memory usage per service
- External API Traffic: User-facing requests (service, method, endpoint, request rate, P95 duration)
- Internal API Traffic: Monitoring and health-check requests (independent of user activity)
- Logs: Recent log entries filterable by namespace or service. For deeper log analysis use Grafana's Explore -> Logs feature in the left panel.
EnterpriseRAG / Services / EDP
Metrics from the Enhanced Data Preparation (EDP) service: ingested documents, links, chunks, and processing statuses.
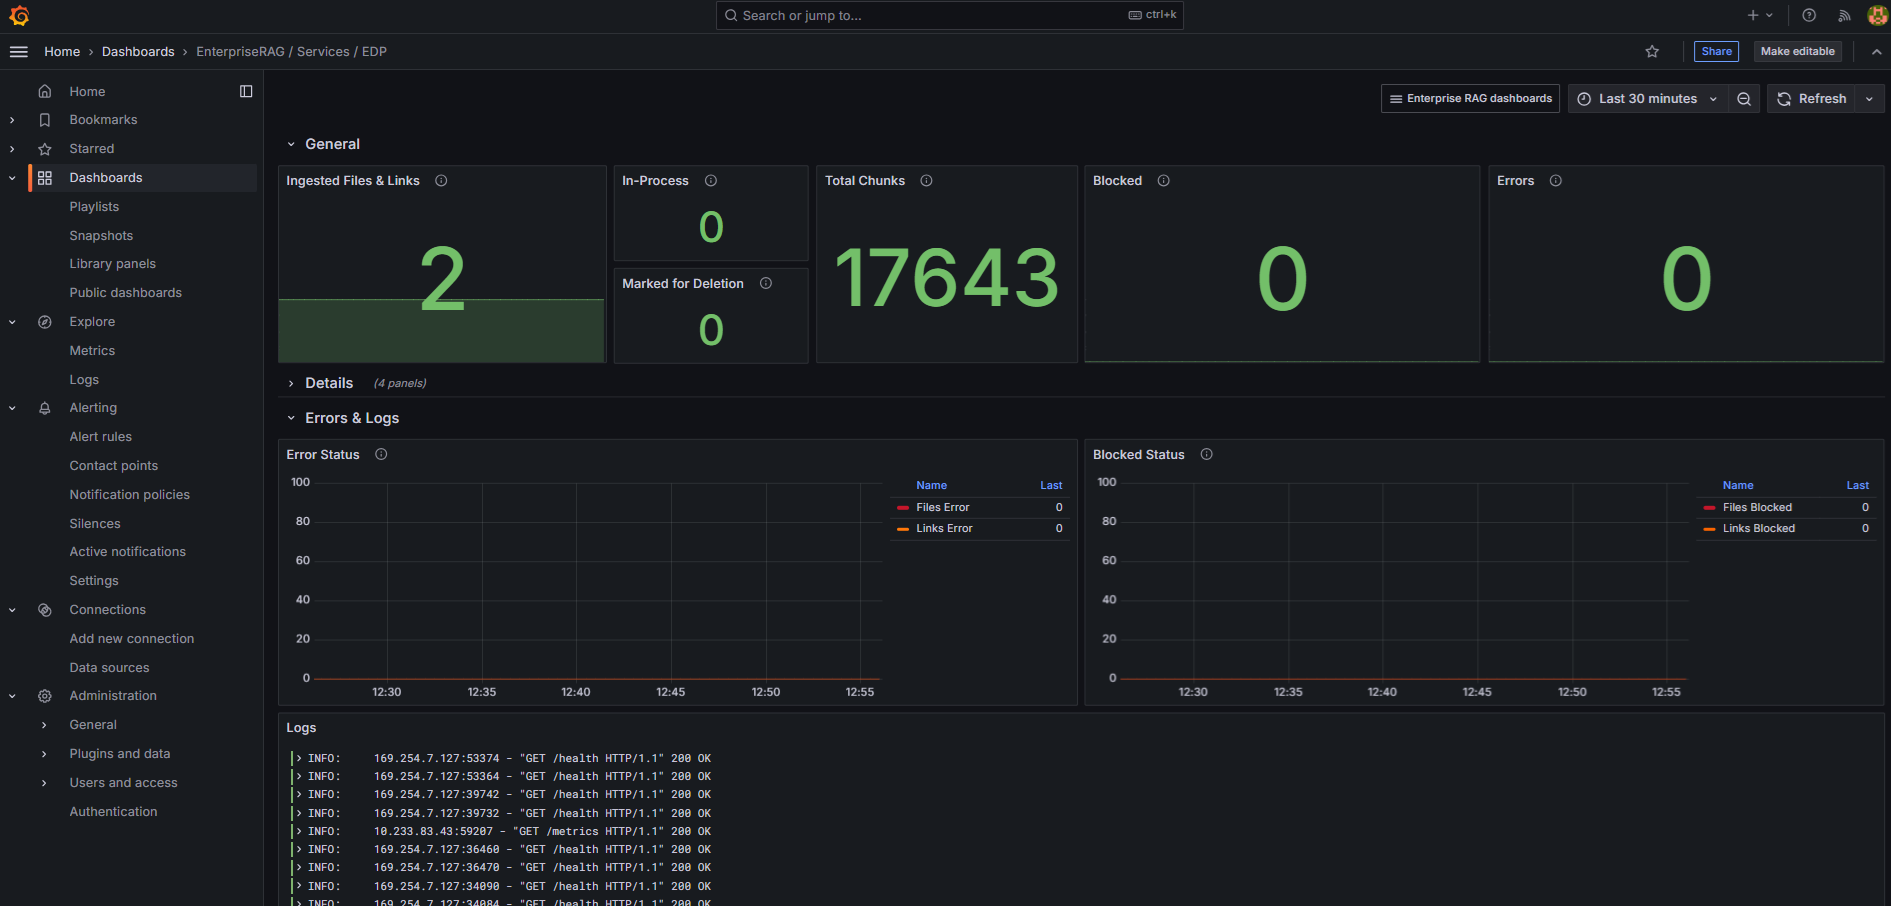
Key panels:
- General: Total ingested files and links, chunks, blocked documents (unsafe content), files in error state
- Details: Trends for files, links, and chunks over time
- Errors and Logs: Registered errors over time and recent logs
- Stage Overview: Items in each processing stage (embedding, input guard scanning, etc.)
See EDP documentation for service details.
EnterpriseRAG / HPA
Horizontal Pod Autoscaler activity: replica count, scaling actions over time, and the metrics used for scaling decisions (current value + threshold).
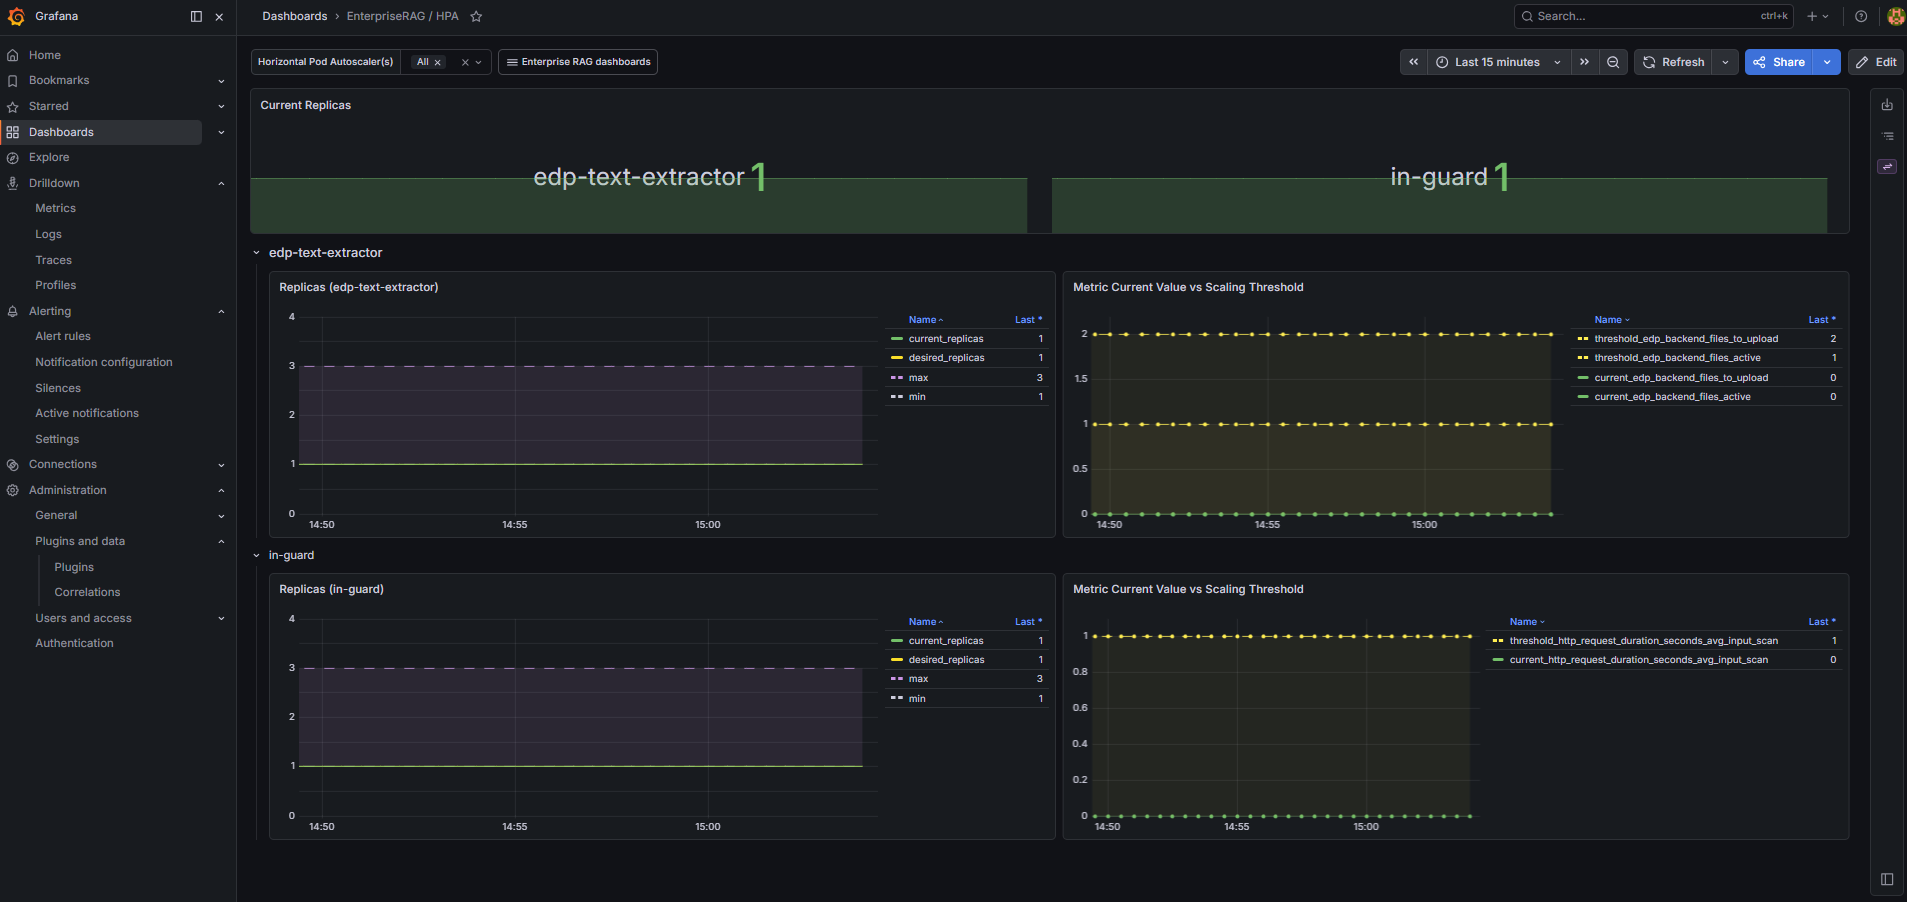
The top panel shows current replica count for each HPA-managed service. Below, each service has a section with replica changes over time and the scaling metric.
See HPA configuration.
Enterprise AI Inference Dashboards (tag modelserving)
Enterprise RAG relies on the Enterprise AI Inference component for LLM model serving. Models are served on vLLM or OpenVINO backends; Grafana provides dashboards for the backend in use. All AI Inference dashboards are tagged with modelserving, making them easy to find by filtering dashboards using that tag.
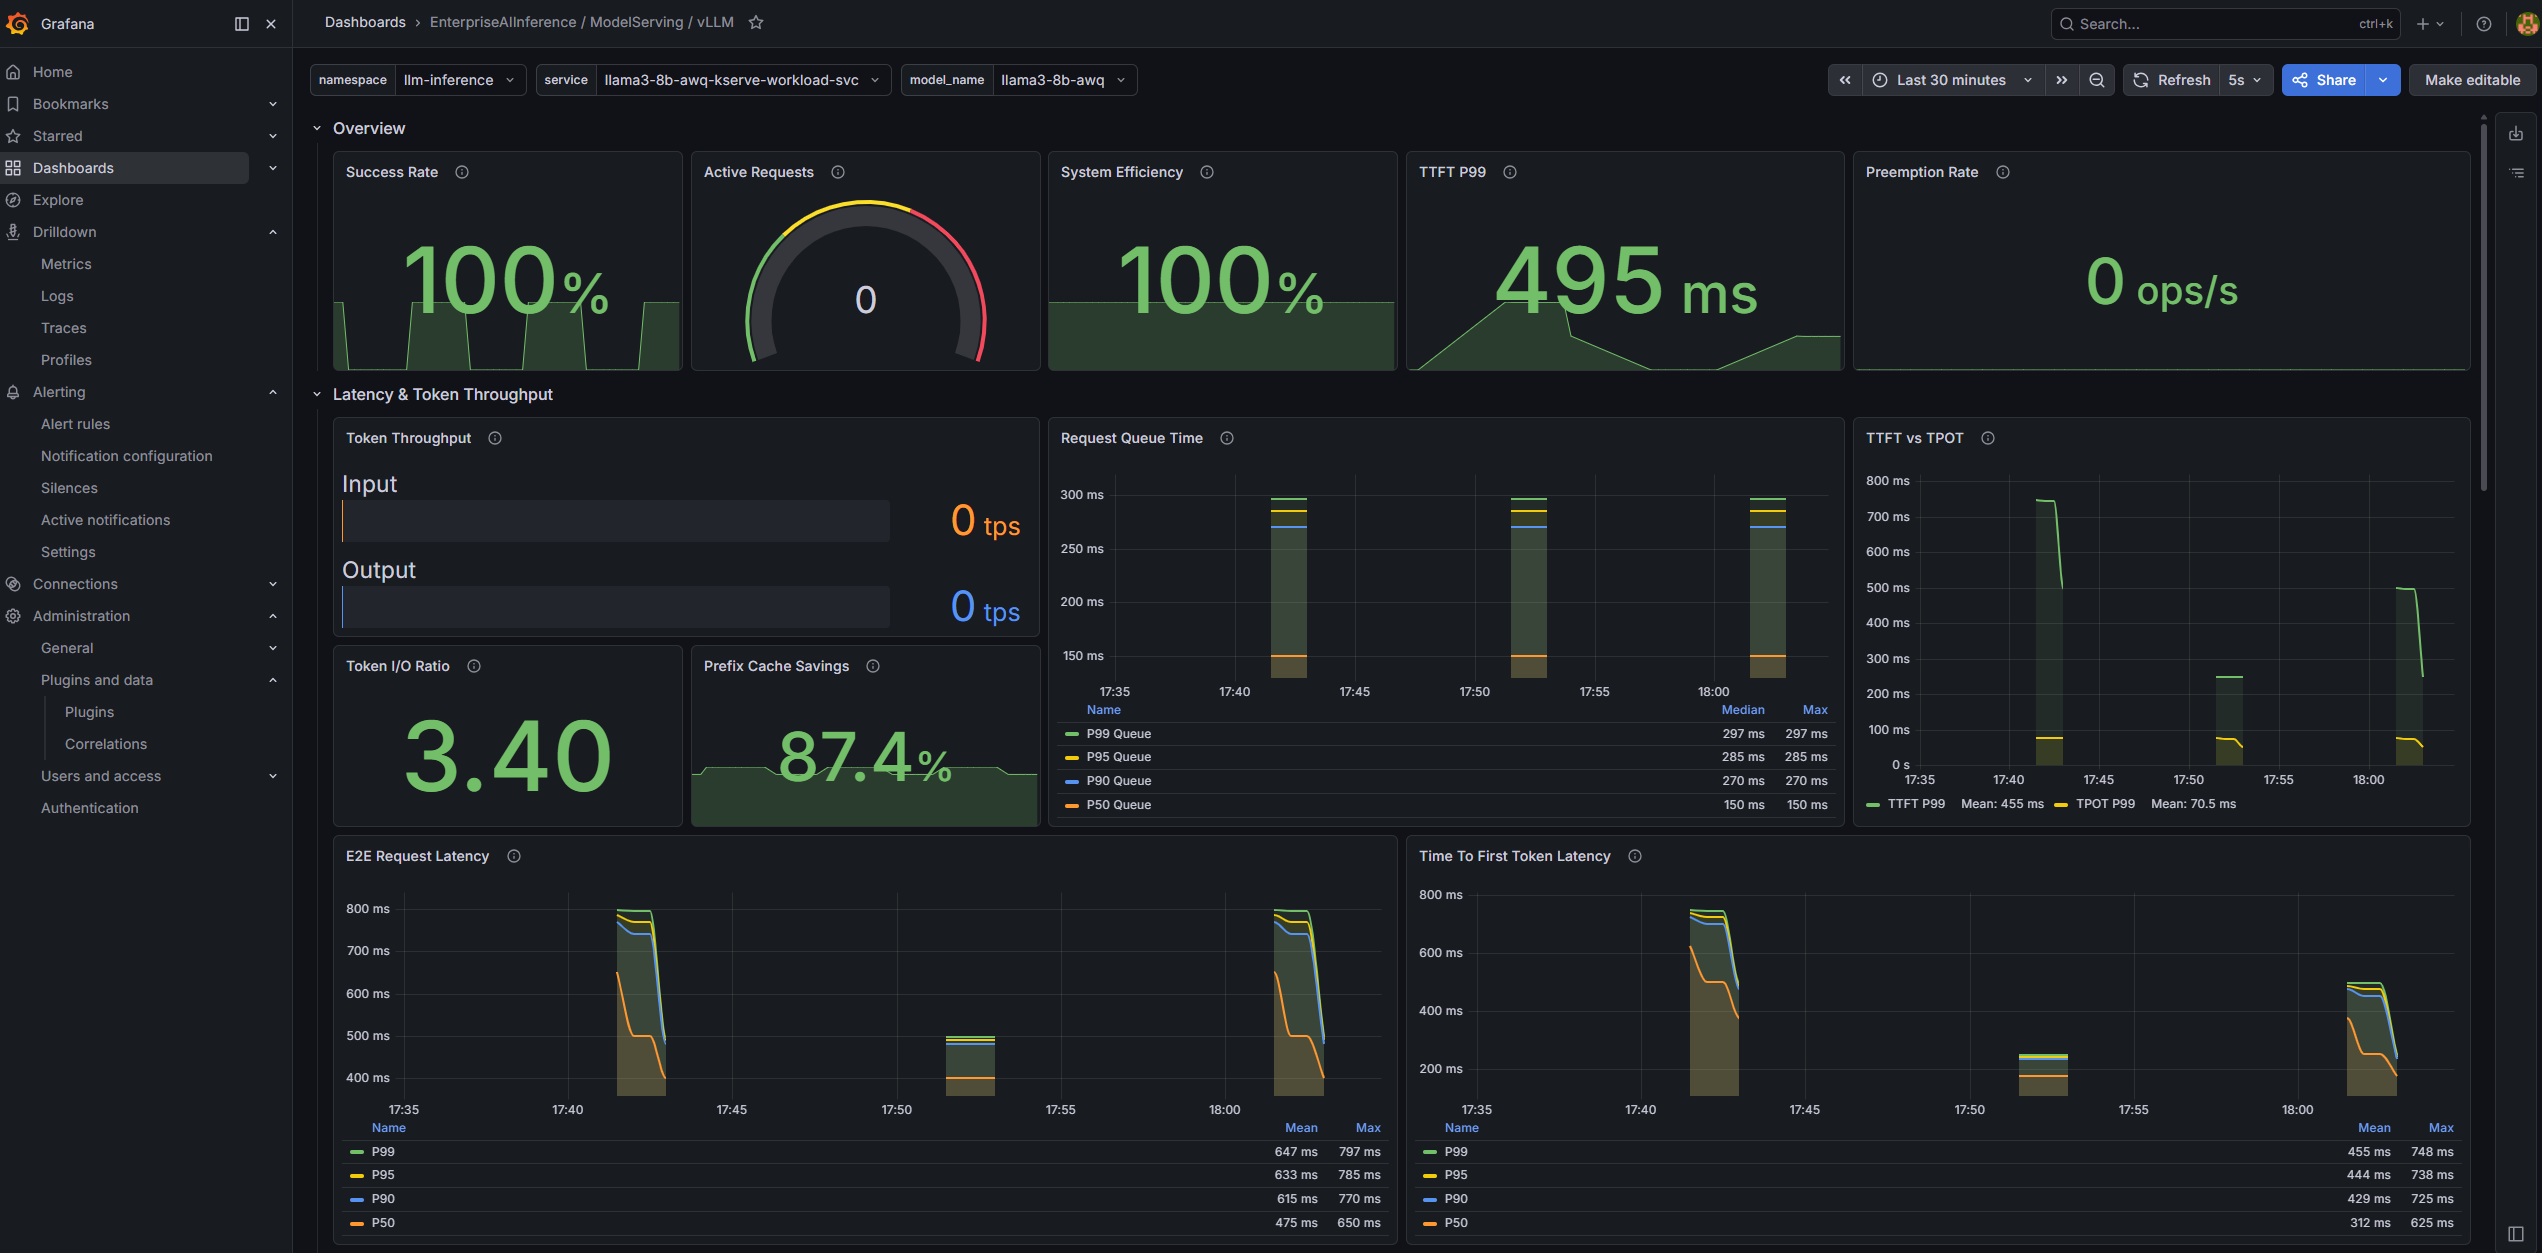
Example dashboard: EnterpriseAIInference / ModelServing / vLLM
Typical panels:
- Request throughput and queue: Incoming requests per second, in-flight requests, queue depth
- Latency: End-to-end request latency and time-to-first-token distributions
- Token metrics: Prompt and generation token counts and rates (useful for capacity planning)
- Engine resource usage: CPU and memory consumption of model-serving pods, correlated with traffic panels
Logs
In the left panel, select Explore -> Logs to access Grafana's integrated log exploration feature. View, search, and filter logs with advanced filtering, real-time streaming, and contextual log inspection.
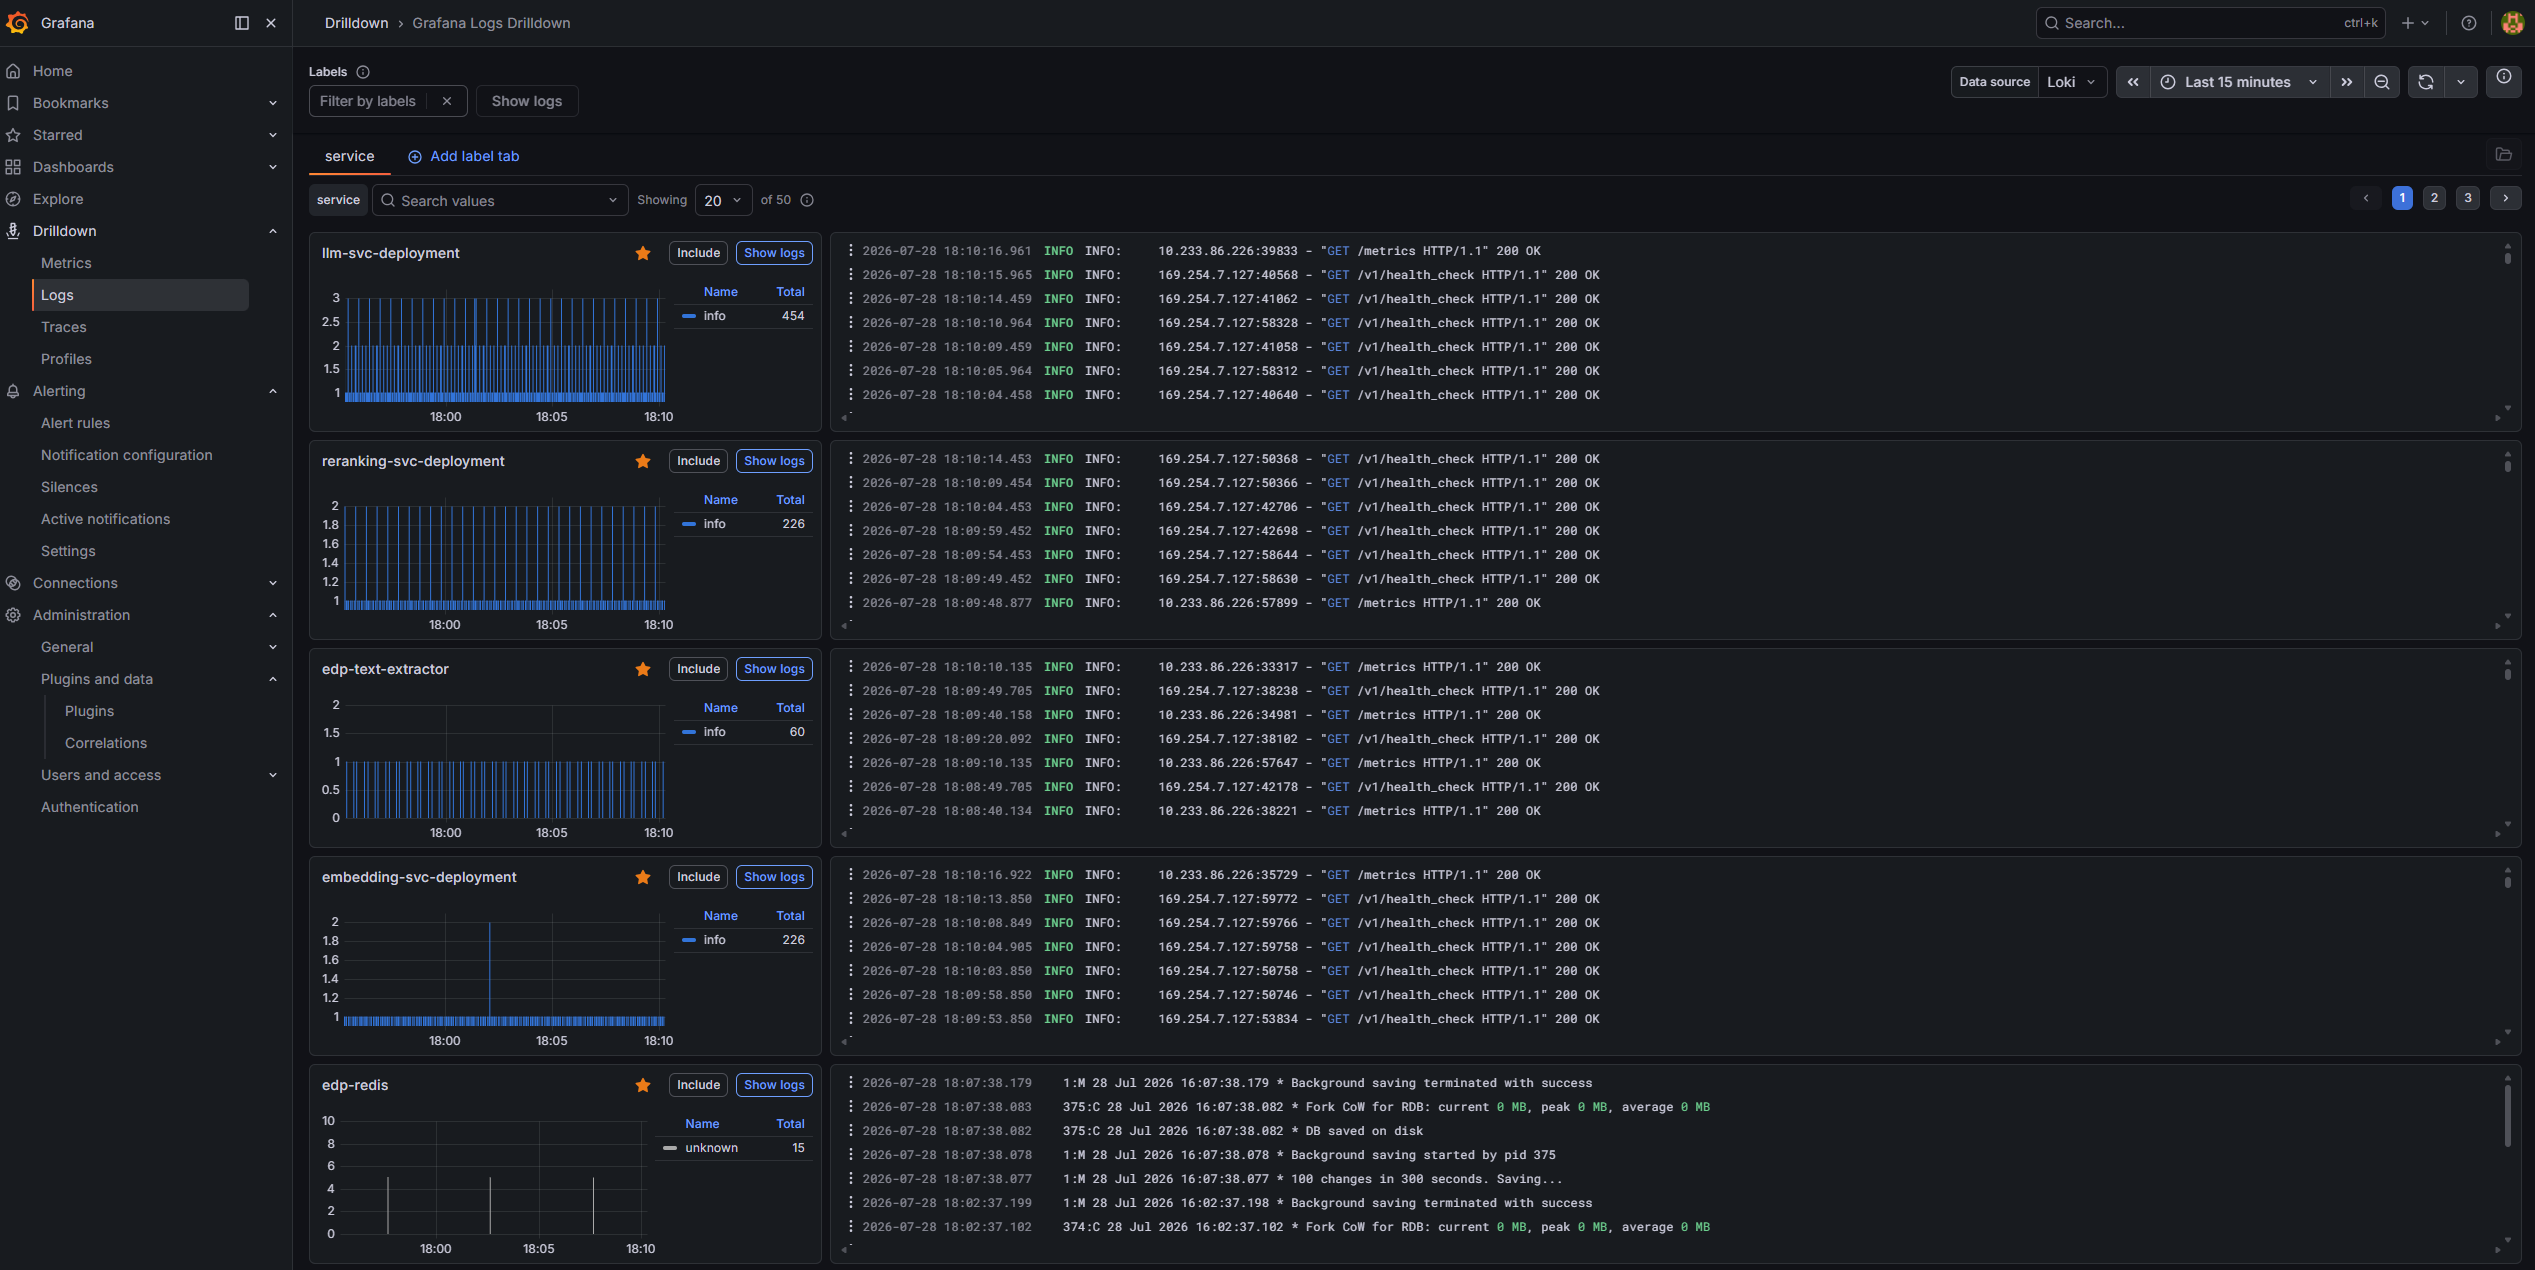
For more on using this feature see Grafana Logs Drilldown documentation.
Platform Telemetry
Grafana itself, Prometheus, Loki, and Tempo are deployed by the platform layer (roles/observability/). For login setup, data retention, and platform-level dashboards see the Enterprise AI Solutions observability documentation: